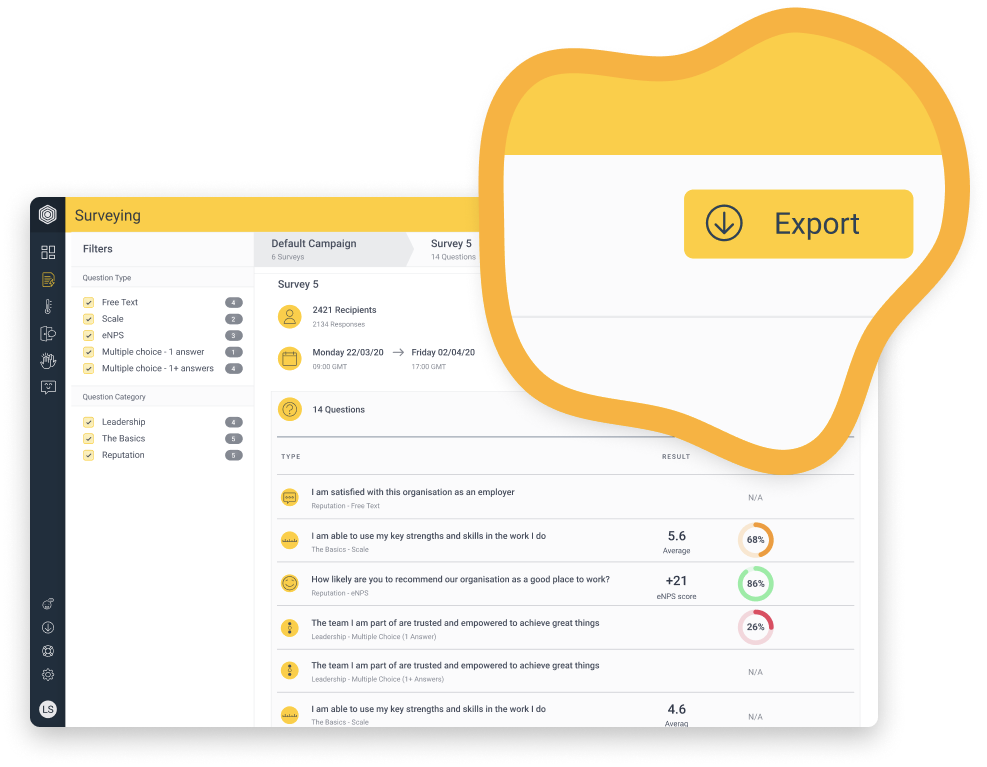
View and analyse survey responses all in one place.
- View headline stats, questions and responses
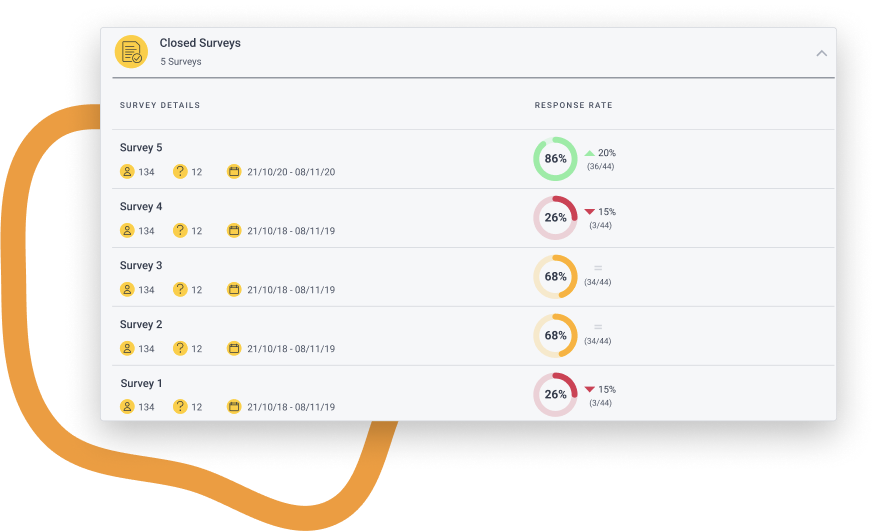
- Compare survey response rates
- Create survey quick reports
- Filter by your bespoke attributes
- Gain insight via score, sentiment and response distribution
Article contents
- What exactly is Hive Surveying?
- How does confidentiality works when analysing surveys?
- Can I see all my previous surveys?
- What are the survey details?
- How do I view an individual survey?
- Can I only see questions in a certain category?
- Am I able to only see scaled/multiple choice/free text questions?
- How do I take the questions and responses out of Hive and create a quick report?
- How do I share the survey results with someone who doesn’t have access to the platform?
- I’ve seen the survey overview, how do I look at an individual question?
- How do the filters work?
- What’s the score/sentiment/answer distribution?
- How do I download the score/sentiment/answer distribution graph?
- Where do I see the question headline stats for all my attributes?
- What is the keyword frequency?
- I’ve seen the scored responses for a question, how do I see the comments?
- How do I search through the comments for a keyword or topic?
- I’ve received a great comment that I'd like to respond to … can I?
- How can I download all my survey results at once?
- What is included in the CSV export?
- How does Hive protect employee confidentiality in these exports?
- Can I download an individual response?
- Any tips on analysing survey responses in Hive?
What exactly is Hive Surveying?
Hive Surveying allows you to view and analyse all of your completed surveys. Whether you want to see the high-level stats, filter by attributes or create a quick report—you can do it all in one place.
How does confidentiality works when analysing surveys?
As always, we are 100% committed to protecting your employees’ identities. When applying filters to your survey results, you can only combine filters until you reach our minimum threshold of 6 responses— so even though you can drill down into attributes, this means you will never be able to identify a single person.
If you want to know more, check out our Confidentiality Commitment, or our Ultimate Guide to Employee Survey Confidentiality.
Can I see all my previous surveys?
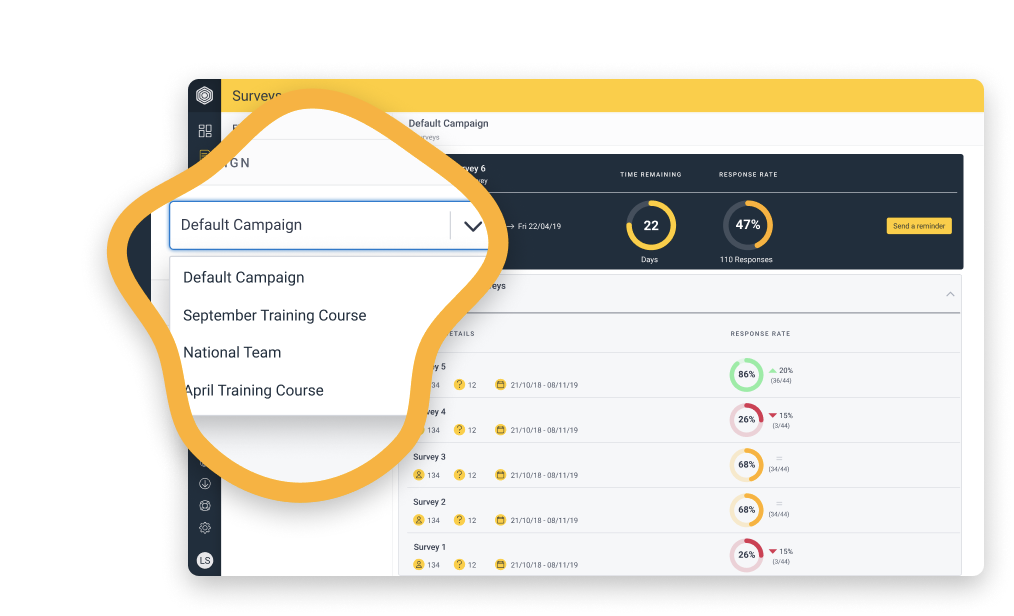
You can see all closed surveys in the date range you have selected.
If you have campaigns enabled, you can select the specific campaign you want to see from the drop-down box on the left-hand side, and surveys related to that campaign will be displayed.
What are the survey details?
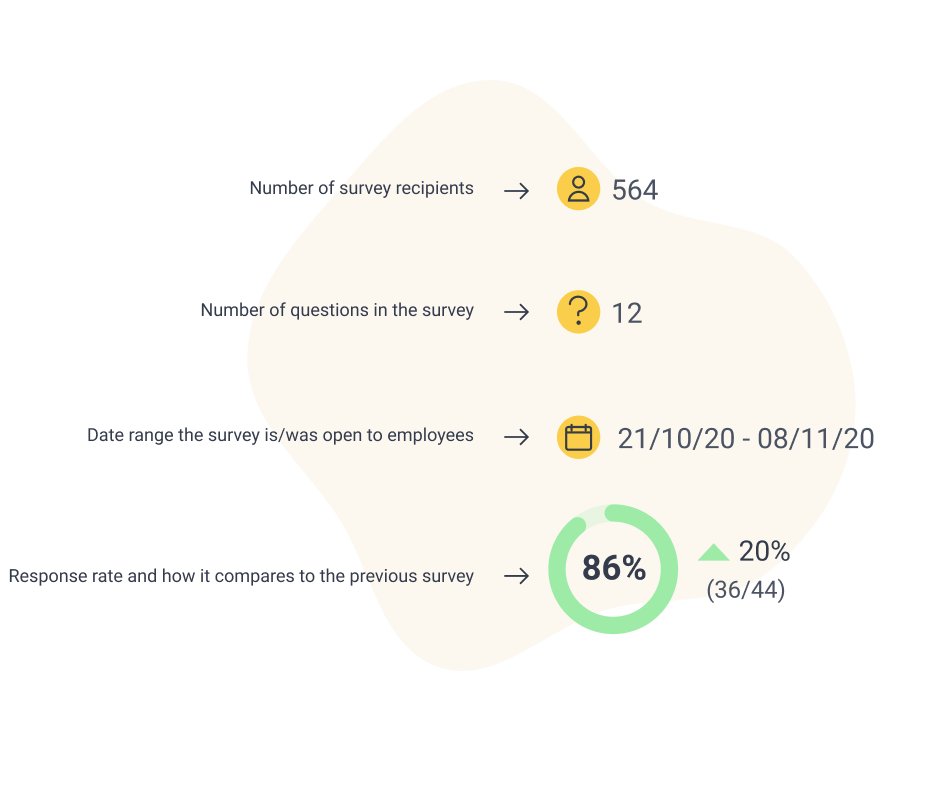
The survey details for each survey include:
How do I view an individual survey?
Simply click on the survey you’d like to view and you’ll see:
📢 High-level survey stats
❓ Questions
🧮 Average score
📊 Sentiment
% What percentage of employees left a comment as well as a scored response
Can I only see questions in a certain category?
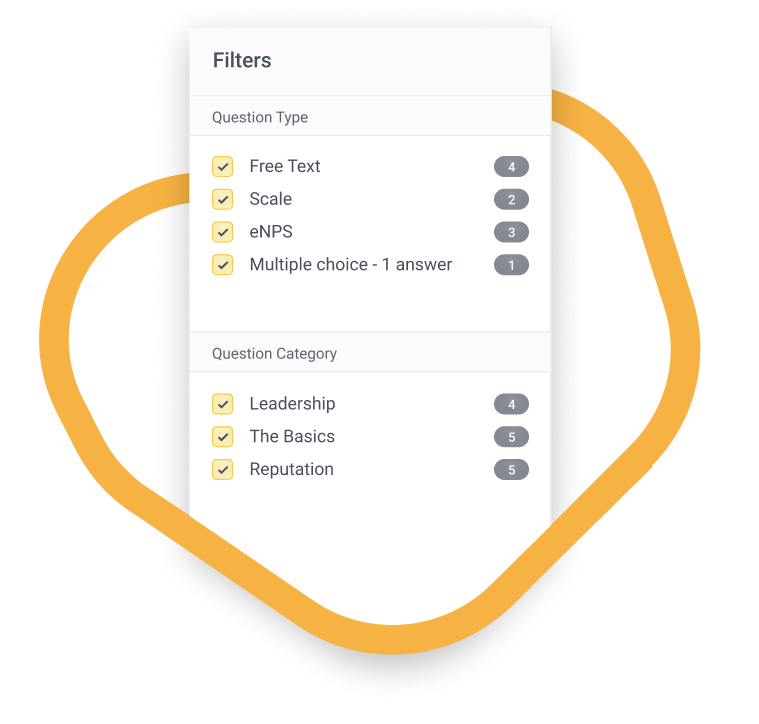
Use the filters on the left to select the categories you’d like to view and you’ll see only the questions that relate to the categories you’ve selected!
Can I only see scaled/multiple choice/free text questions?
Using the filters on the left, simply select the question type you’d like to see and Hive will then display the question types you’ve chosen.
How do I take the questions and responses out of Hive and create a quick report?
We know you’ll want to take survey responses out of Hive to create a presentation/report. Our quick reports give you the perfect starting point for a presentation!
Simply click the ‘Export’ button, select the attribute you’d like to report on, add a description/overview to give the survey some background, and press ‘Export my report’. From there, you can open and begin editing the report in PowerPoint, Google Slides or any other compatible programme.
Can I to share the survey results with someone who doesn’t have access to the platform?
You can print or download an overview of your survey results and key metric scores using the ‘Print’ button. This can be found on both your survey overview and question detail pages.
Any filters or attribute tables selected will be applied when you print this page. If you would like to get a full overview of your survey, make sure to clear all your filters and open each attribute table.
This feature is supported in most common web browsers and any export details can be adjusted in your own web browser or print settings.
I’ve seen the survey overview, how do I look at an individual question?
Easy—click the question and you’re in!

This figure shows how many recipients this question was sent to.
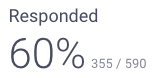
This figure is the percentage of recipients that responded to this question, and the actual number of responses.
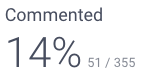
If comments are enabled for a scaled or multiple choice question, this figure shows the percentage of respondents who left a comment, and the actual number of comments.
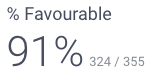
For scaled questions, this figure shows the percentage of respondents who gave a score above a neutral response (6+), and the actual number of above neutral responses.
For scaled questions, this figure represents the average score for this question.
How do the filters work?
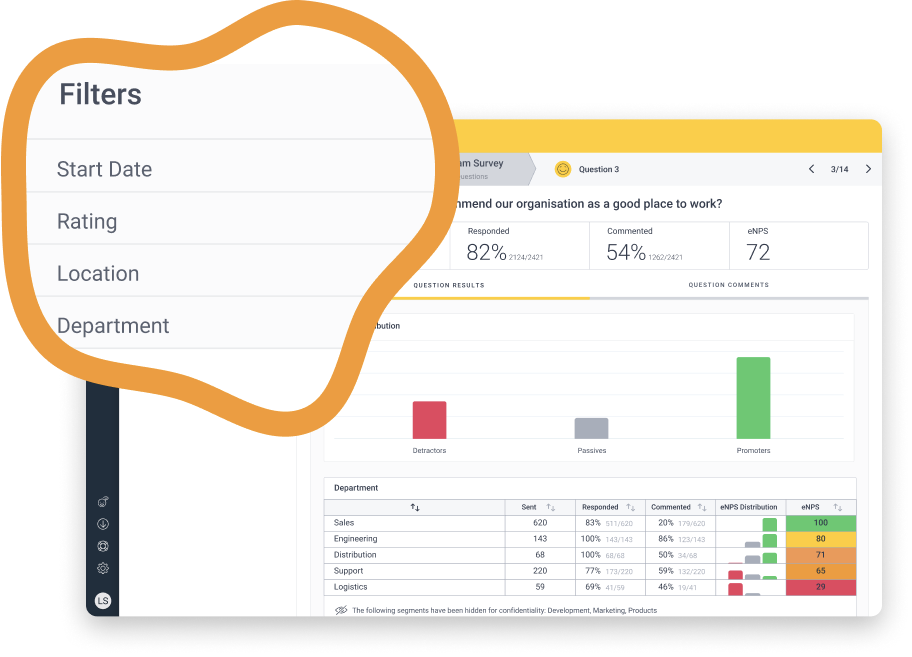
Once on an individual question page, you’ll see the filters down the left which display score ratings/sentiment, as well as all your bespoke attributes, e.g. department, location, gender.
Our filtered view lets you explore further into how each demographic scored and how it compares to the rest of your organisation. And the filters are be applied at the survey level—so you can easily switch between different questions in a survey without losing your filters for easier analysis.
To make sure we safeguard the confidentiality of smaller teams, we've made it impossible to search and filter demographics that show the source of a response. You can only combine filters until you reach our minimum threshold of 6 respondents.
What’s the score/sentiment/answer distribution?
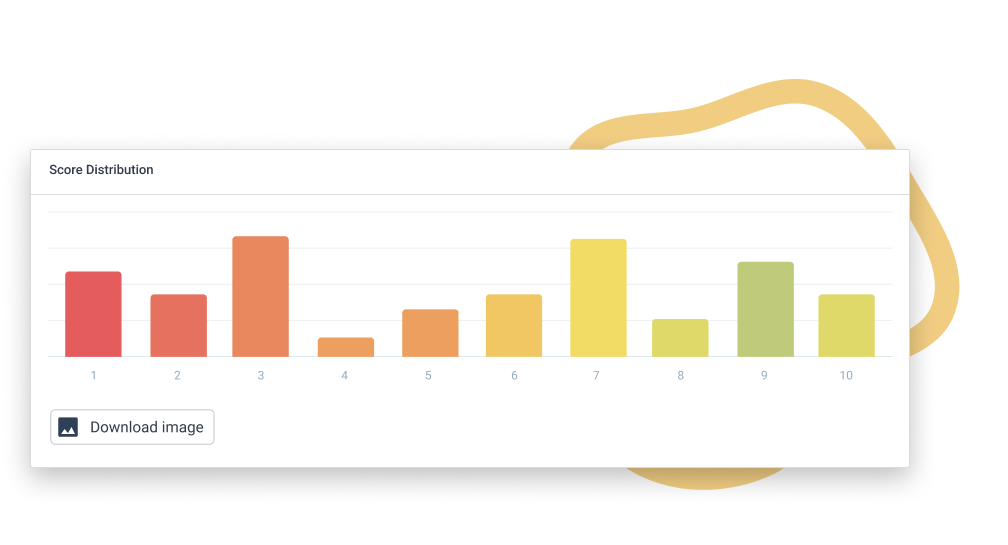
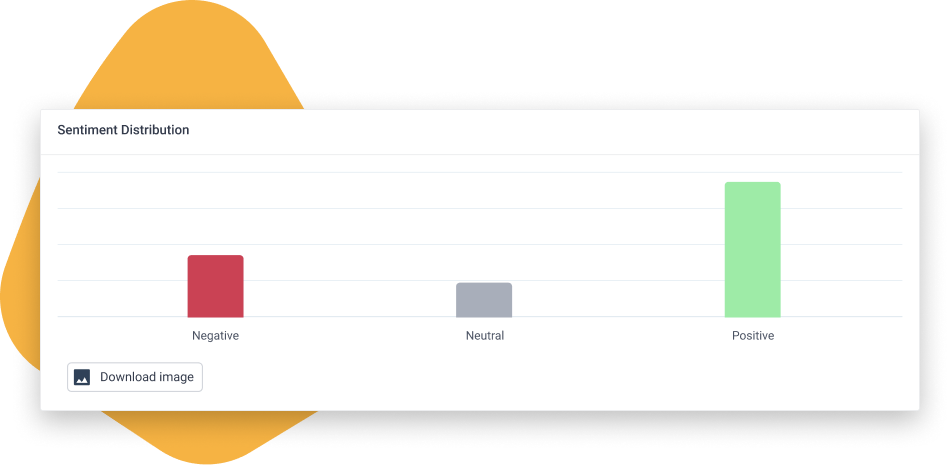
In the ‘Question Results’ tab you’ll see the bar chart which gives you an overview of your score/sentiment/answer distribution for the question in a clear and easily digestible way.
In the score distribution, Hive uses a 0-10 scale, with any score between 0-4 is categorised as unfavourable, 5 is neutral, and 6-10 is categorised as favourable.
In the sentiment distribution, Hive uses tone, language and structure of a response to identify it as negative, neutral or positive. It’s important to note that this analysis is completed by technology, not a member of the team, so it can’t pick up on sarcasm!
In the answer distribution, Hive presents the multiple choice options and the number of responses for each.
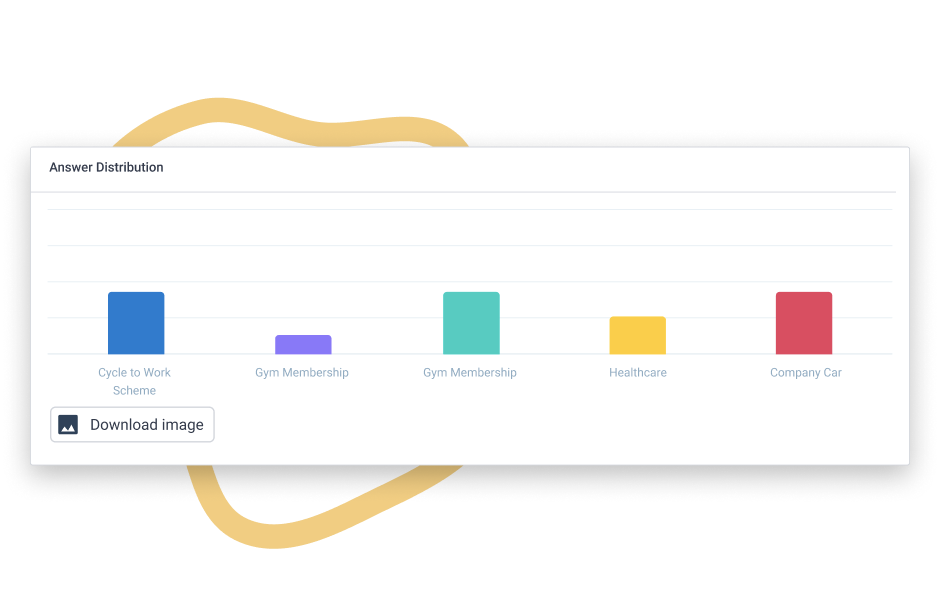
Can I download the score/sentiment/answer distribution graph?
Simply download the graph as an image by clicking the ‘Download image’ button. Any filters (department, location, function) applied will still be applied. So if you’d like to see every bit of feedback, make sure you’ve cleared the filters!

Where do I see the question headline stats for all my attributes?
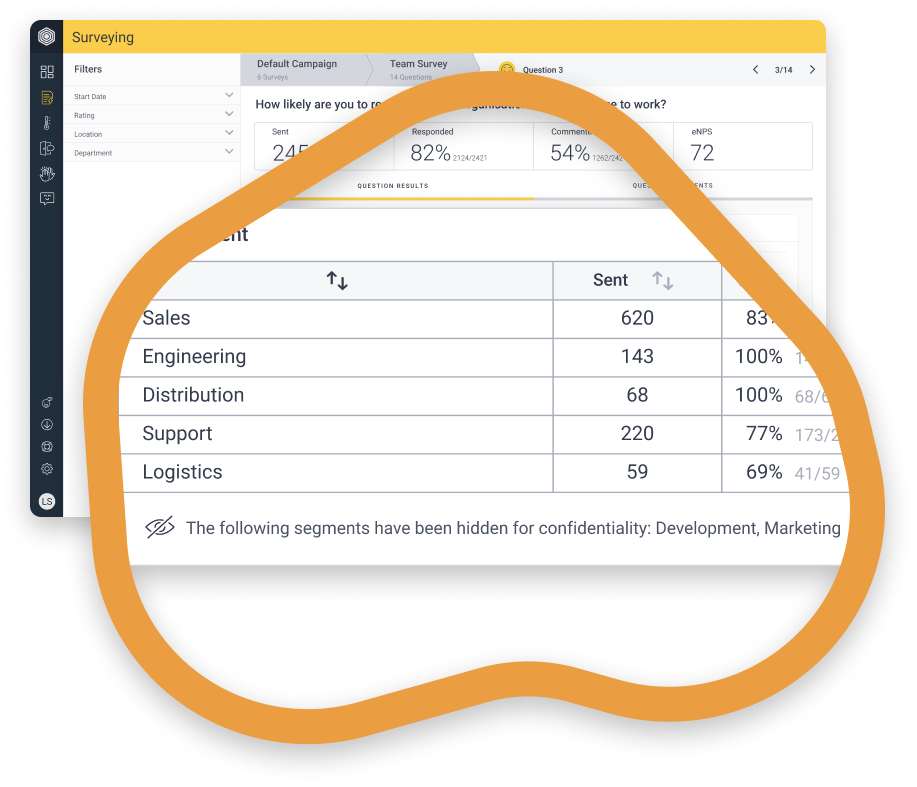
You’ll find your attributes underneath the score/sentiment/answer distribution; just click on the arrow to expand the attribute you want to look at. Here, you’ll see a breakdown of each attribute, along with stats such as sent, responded, etc.
Remember, segments may be hidden due to confidentiality!
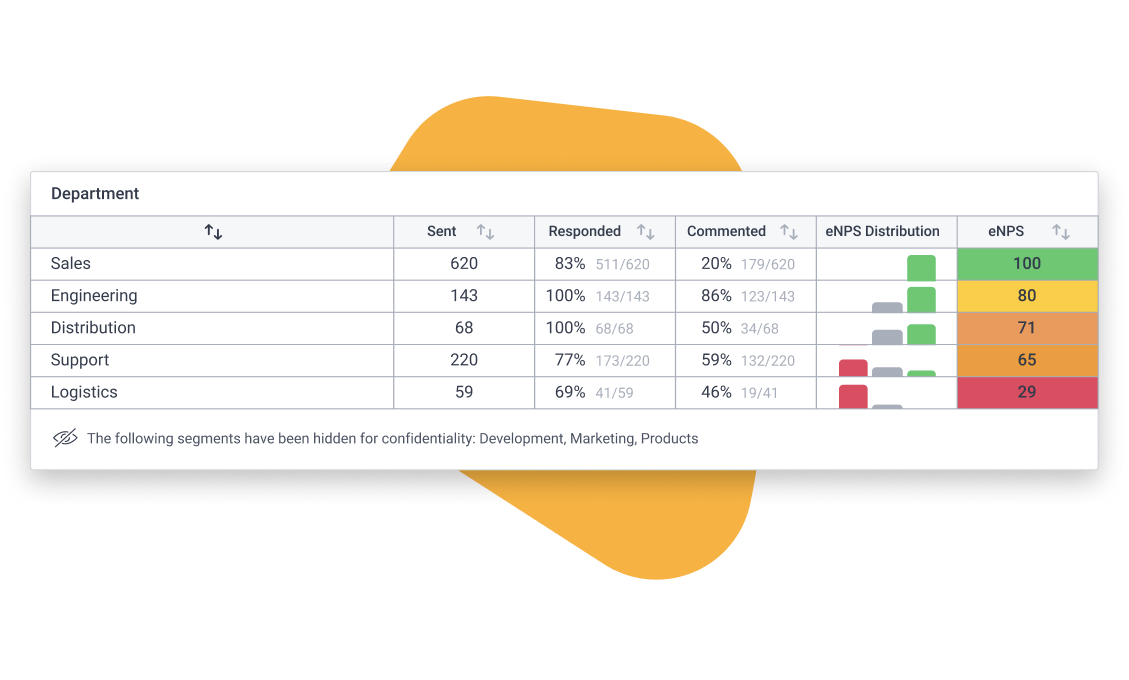
Scaled responses are ordered by average score, from highest to lowest. Free text and multiple choice responses will be ordered alphabetically. If you’d like to order the cuts of data in a different way, just click the arrow next to the statistic.
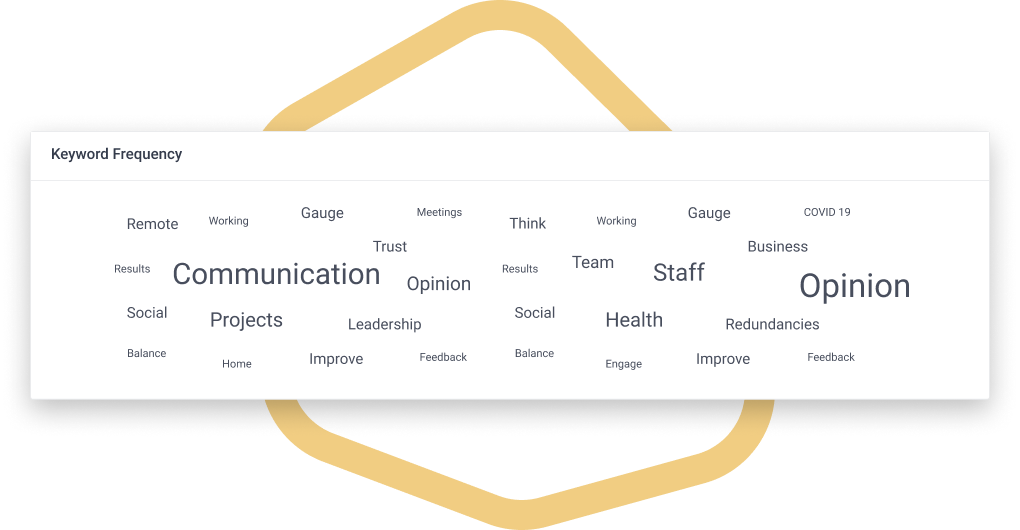
What is the keyword frequency?
This is sometimes referred to as a ‘word cloud’. The most commonly used words across the responses to this question are shown, with the most frequent words in larger text—such as “policy”, “training”, or “equality”. This saves you reading through all the responses (yawn!) and pulling out hot topics and issues by automatically analysing responses and presenting these back.
I’ve seen the scored responses for a question, how do I see the comments?
Simply move from the ‘question results’ tab to the ‘question responses’ tab and you’ll see all the comments that your respondents have left.
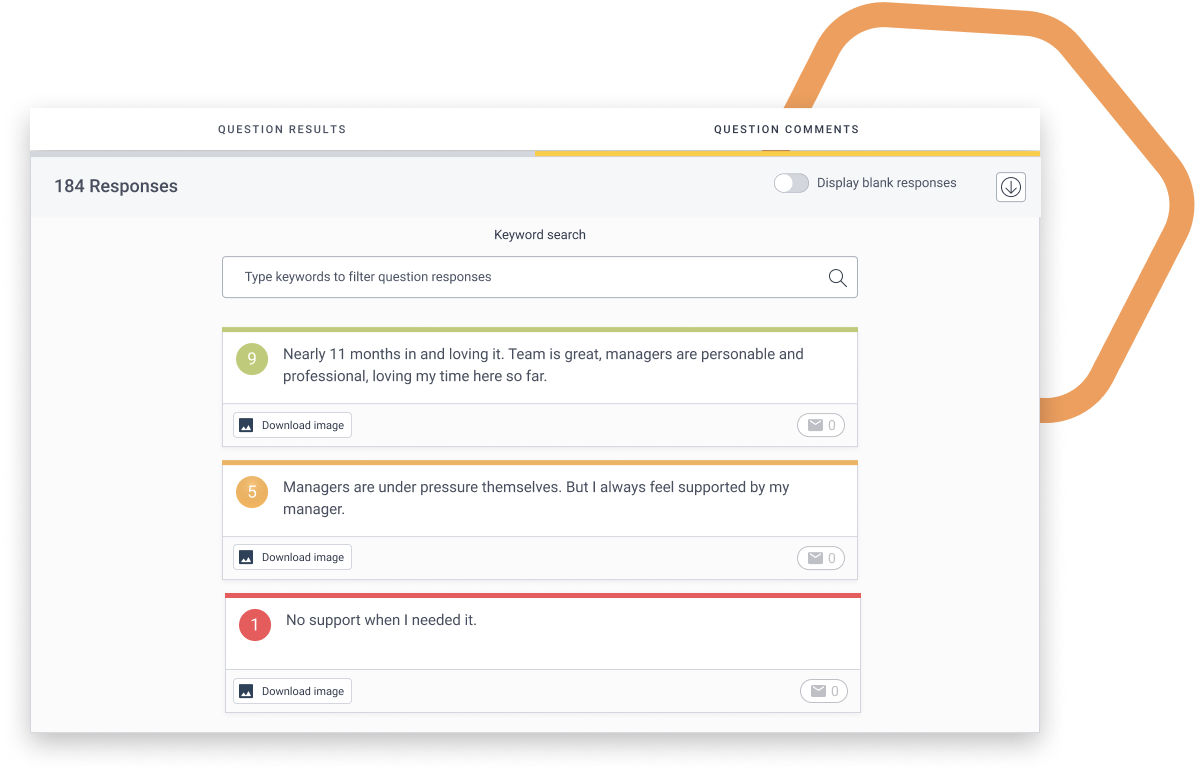
As default, scores without comments aren’t shown, but you can use the ‘display blank responses’ toggle to change this.
How do I search through the comments for a keyword or topic?
The keyword search allows you to filter through the comments to drill into a certain topic, like “pride”, “mental health”, or “manager”.
I’ve received a great comment that I'd like to respond to 💬 … can I?
Hive Messenger allows you to begin a (confidential) conversation with an employee. Whether you’re asking for more detail, thanking them for their comment or simply closing the feedback loop—just click the envelope button and start the convo!

How can I download all my survey results at once?
On the survey dashboard, use the Export Responses button to generate a single CSV file containing all question scores, text responses, and selected options for your currently active filters.
What is included in the CSV export?
The export is structured for easy offline reporting:
- Question Columns: Each survey question is assigned its own column.
- Integrated Comments: If a question has comments enabled, a dedicated comment column will appear immediately next to the score column for that question.
- Segmented Data: The export automatically respects the filters (such as department or location) you have selected on your dashboard.
How does Hive protect employee confidentiality in these exports?
We take confidentiality seriously to ensure employees feel safe providing honest feedback:
- Independent Randomisation: The order of responses is randomised independently for every single column. This means a response in Row 1, Column A is not linked to the response in Row 1, Column B. No single row represents one individual's complete set of answers.
- Confidentiality Thresholds: If the number of responses for your selected filters falls below your organisation’s set confidentiality threshold, the export will not contain any data.
Can I download an individual response?
Of course, when you see a response you want to download just click the ‘Download image’ button and you’re good to go!

Any tips on analysing survey responses in Hive?
💪 Getting feedback isn’t always easy, but it’s an important step to driving positive change
🚪 Leave your ego at the door
⛔️ Never try to figure out an employee’s identity
🧪 Our People Science team are on hand to create bespoke reports