Gather survey headlines into one report, in one click.
- Quickly create a headline report at the click of a button
- Use as a starting point for larger presentations or as is
- Report on any of your bespoke attributes
Article contents
- What exactly are quick reports?
- How does it work?
- How do I create a quick report?
- What’s actually included in a quick report?
- How do I export a quick report?
- I’d like a more detailed report on a survey… can I get one?
- Any tips on using quick reports?
What exactly are quick reports?
Presenting headline results is a really powerful way to keep both employees and key stakeholders engaged in change, especially when you’re surveying regularly. Quick reports are automatically created short presentations that consist of a selected attribute and high-level results, ready for you to download and edit!
How does it work?
Hive platform admins can export any completed survey into a quick report—and they’re compatible with PowerPoint, Keynote, and Google Slides! When downloaded, your scale-based survey results are broken-down into key headlines using easily digestible infographics, and the exported slide deck is editable so that you can add your own narrative.
Creating reports from the survey data in your Hive completely from scratch can sometimes be a pain, but quick reports do all the hard work!
How do I create a quick report?
In your Hive dashboard, when looking at an individual survey overview page, simply:
-
Click the ‘Export’ button in the top right corner
-
Select the attribute you’d like to report on
-
Add a description/overview to give the survey some background (this will appear on the second slide)
-
Press ‘Export my report’
-
Open the file in PowerPoint, Keynote, Google Slides or any other compatible programme to use as it is or begin editing

What’s actually included in a quick report?
Though the data will change from survey to survey, quick reports consist of:
Slide 1: Title
-
Organisation name
-
Survey title
-
Survey window

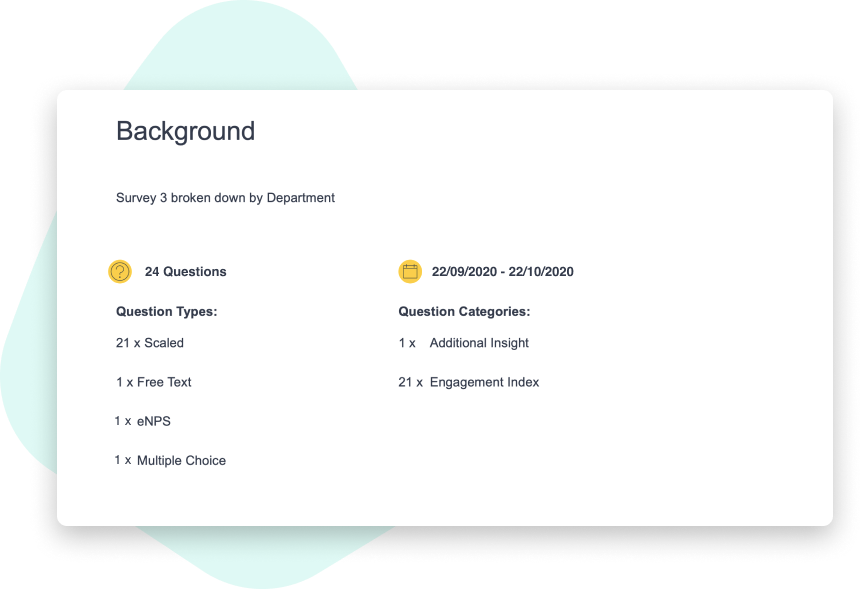
Slide 2: Background
-
Customisable context (the description you wrote when exporting your report)
-
Summary of questions (type and categories)
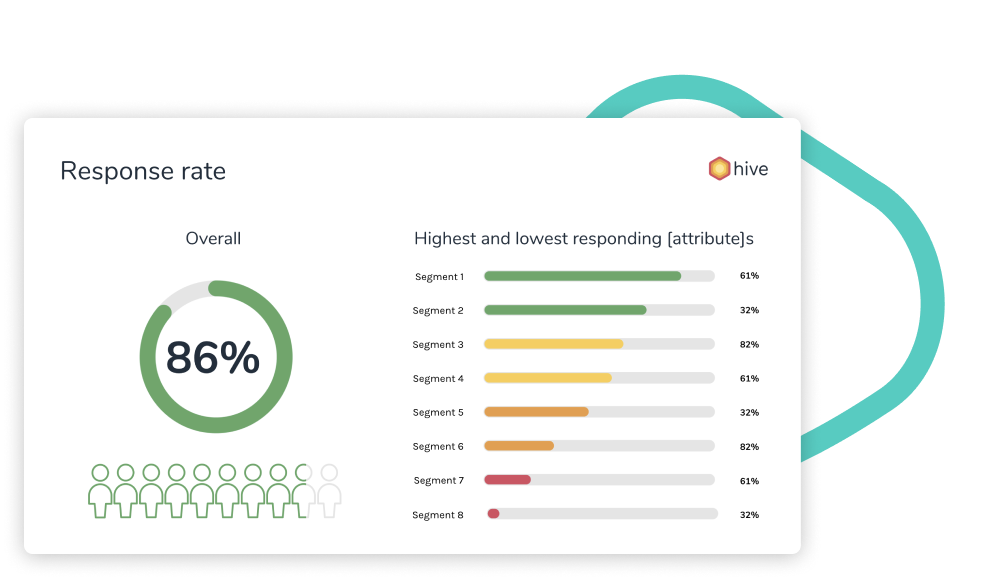
Slide 3: Response rate
-
Overall response rate
-
Response rate breakdown by your selected attribute (if there are more than 6 segments, the 3 highest and 3 lowest response rates will be displayed)
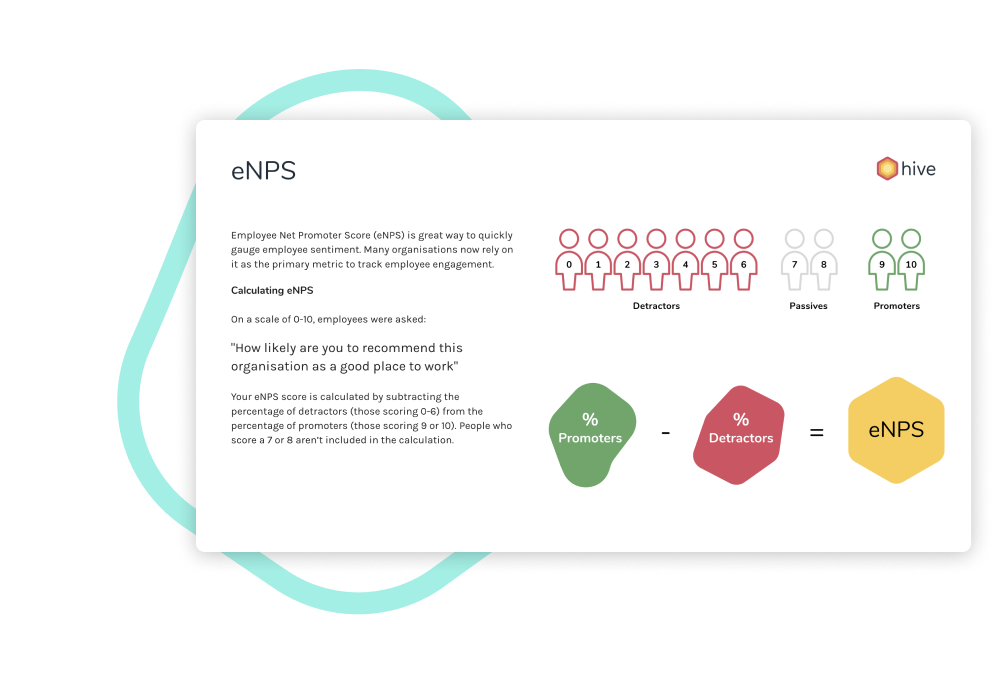
Slides 4-6: eNPS
If the eNPS question has been asked, it will be included in the report here (regardless of where the eNPS question appears in the survey). If the eNPS question has not been asked, this slide will not appear.
Your eNPS report is separated into three sections:
-
Context
-
Overall organisation score
-
Breakdown by selected attribute (if there are more than 6 segments, the 3 highest and 3 lowest eNPS scores will be displayed)
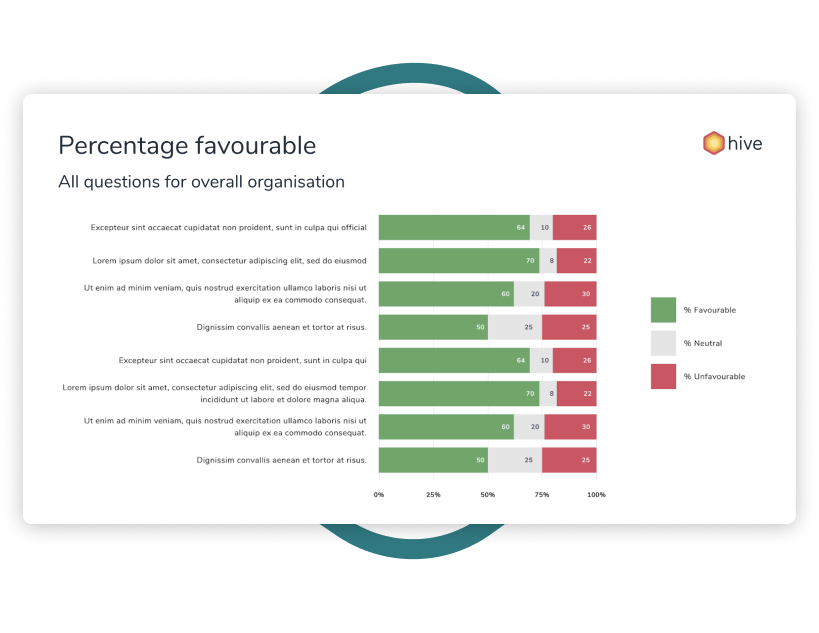
Slide 7: Percentage favourable
Positive scores for any scale questions at an organisation level (if there are more than 6 questions, the 3 highest and 3 lowest scores will be displayed).
How do I export a quick report?
View this article for a video walkthrough.
I’d like a more detailed report on a survey 📈 … can I get one?
Of course! Our Professional Services Team are always on hand to create tailored reports. Just get in touch with your Account Manager to share your requirements and receive a quote.
Any tips on using quick reports?
👥 Remember, you can only select one attribute at a time to report on
💬 Stats need narrative and context to make real impact
🚀 Use quick reports as a starting point, but expand the report to help bring it to life—try using images that you can download from your Hive