Find out how you stack up against other Hive customers and understand trends within different industries
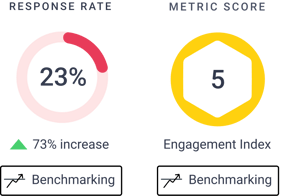
- Benchmark and track response rates, eNPS and engagement index
- Compare with a Hive benchmark from the last 3, 6 or 12 months
- More insight for your decision-making
- Easily identify areas to focus on
- Monitor progress to understand the impact you’re having
- Fast, easy comparison
- Download comparisons as an image
Article contents
- What is benchmarking?
- How does it work?
- Can I share it with someone?
- What type of survey can I use with our Hive Benchmark?
- Who has access to the benchmarking feature?
What is benchmarking?
From within the Hive platform, you can compare your response rates, eNPS and engagement index with previous surveys and the Hive customer benchmark (the average for all our customers).
You'll also be able to gain a more in-depth segmentation that allows you to benchmark by industry and organisation size.
In other words, you can see at a glance how those scores have changed over time, and how they contrast with other organisations who use Hive.
How does it work?
You can compare that data from an eNPS or engagement survey with one of your previous surveys of the same type, or with the Hive benchmark from the last 3, 6 or 12 months.
Once your survey has closed, then just follow these simple steps to start benchmarking:
-
Make sure you have “Administrator - Benchmarking” permission—otherwise you won’t be able to see the benchmarking data.
-
Navigate to the Engagement Index or eNPS survey you wish to view the benchmarking data for
- Click on the “Benchmarking” button on the top right of the screen alongside the survey overview data
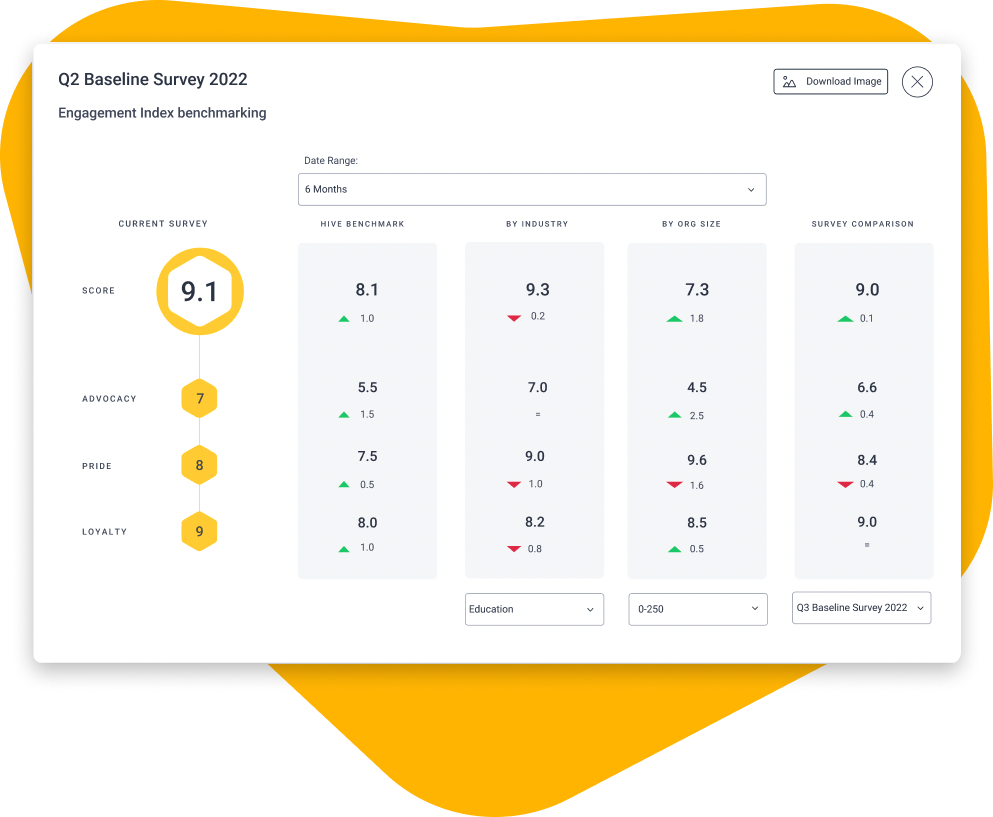
From there, you can compare the selected survey’s response rate, eNPS or engagement index against surveys you’ve run in the past, or against the Hive customer benchmark.
To compare the results of the survey you’re viewing against a previous one, just select the other survey from the Survey Comparison section (note: must be a closed Engagement Index or eNPS survey in the default category).
You can then also select a date range and an industry and organisation size you want to view the Hive Benchmark data by: Previous 3, 6 or 12 Months.
Can I share it with someone?
Yes, all you need to do is press the download button and you’ll have an image ready to share.
What type of survey can I use with our Hive Benchmark?
When you send a survey to everyone within your organisation using both the Engagement Index and eNPS survey types, you will be able to view our Hive Benchmark.
Who has access to the benchmarking feature?
There will be new permission created for this feature "Administrator - Benchmarking“. Only users with the “Benchmarking“ permission are able to view the Hive Benchmark data.
The new Benchmarking permission will be given to all users who have the “Manager - Surveys“ AND “Manager - All Segments“ permissions. Users without this permission will be able to view the benchmarking button and view results for the "Survey Comparison" but not the Hive Benchmark.
If you need to update any information or access for an individual or a handful of employees, it's best to navigate to the Users section in your Hive and make the changes there. Simply access the User page and find the employee you wish to edit, click the three little dots to the right of their name and change any or all of the applicable info there.
When is the Hive Benchmark updated?
At the start of every month, the Hive Benchmark will be updated to include the previous 3, 6 & 12 months' worth of data.
What are the industry breakdowns?
-
Construction and Heavy Industry
-
Creative and Media
-
Education
-
Entertainment and Recreation
-
Government
-
Health
-
Hospitality
-
Housing Associations
-
Logistics and Transport
-
Manufacturing
-
Retail
-
Technology
-
Nonprofit
-
Professional Services
What organisation size’s can I select?
- 0-250
- 251-500
- 501-1000
- 1001-5000
- 5001+
I can see a confidentiality icon, what does this mean?
You may see the confidentiality icon appear for some organisation sizes or industries when they have been selected. This will show up for those industries or organisation sizes that don't meet our minimum benchmarking data threshold.