Hive’s universal engagement measure—an accurate and easily trackable snapshot of how your people are feeling at a glance.
-
Simplified and consistent engagement tracking
-
Get an idea for how your people are feeling at a glance
-
One metric to measure the success of people-focused activities
What is Hive’s engagement index?
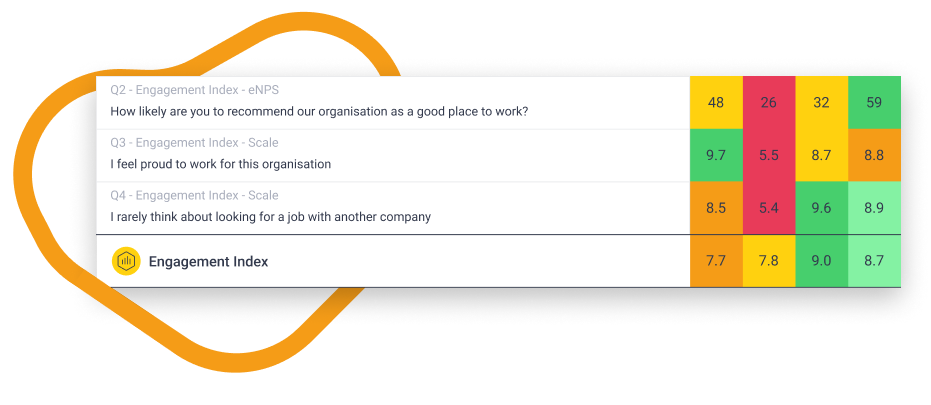
Backed by our employee voice and data experts Hive’s engagement index is the average of three metrics:
-
Advocacy (eNPS question): How likely are you to recommend our organisation as a good place to work?
-
Pride: I feel proud to work for this organisation
-
Loyalty: I rarely think about looking for a job with another company
With this index, you’ll be able to see an accurate snapshot of how your people are feeling at a glance, and track that consistently over time.
What does a 'good' score look like?
7 and above = positive
5 - 6.9 = moderate
3 - 4.9 = slightly negative
2.9 and below = negative
How do you use the engagement index?
To use the engagement index in your next survey, go into Hive’s survey builder tool and create a new Engagement Survey (you can’t include an engagement index in a Custom or eNPS Survey).

Note: you have to use the engagement index tool in order to get an overall engagement score; adding the three engagement questions into a survey without using the index will just give you those three individual scores.
When you select this option, the engagement index component will already be added into your survey by default.

Note: with the exception of results segmentation questions, the engagement index questions will always appear at the end of the survey—so you won’t be able to change their position in our survey builder.
Once you’ve launched your survey and the responses have started coming in, you’ll see your engagement index score on the Survey Dashboard and Survey pages. This will make it easy to track over time and give you a clear indication when something needs to be addressed. And if you want to know what’s causing any increase or decrease in the score, our Professional Services team will be happy to do a driver analysis for you!

And in the heatmaps, you’ll find the scores for the three drivers alongside the overall engagement index score.
Note: The engagement survey option will only appear if you use a 0-10 scale so we can build benchmarking data on Hive's recommended scale. Speak to support if you want to change your scale.

And in related news, we’ve also improved the filters you use in the platform to make it easier to analyse survey results. Filters will now be applied at the survey level—so you can easily switch between different questions in a survey without losing your filters for easier analysis.